I have recently started the Metis Data Science immersive program in Seattle. I am apart of the Fall 2018 cohort, and I will be bloging about the Data Science projects I will be creating throughout my 12 week program. On to the first project…
WomenYesWomenTech
WomenYesWomenTech (WYWT) is an organization that hosts an annual gala in early summer to promote women in tech. They have hosted the gala for many years and the gala attendees are invited through a canvassing campaign in NYC. The volunteers attempt to get email addresses of potential participants by standing outside MTA stations to invite them to the gala. A pretty simple idea, WYWT goes to the streets of New York to garner support for their great organization, and have a big celebration / fundraiser in the form of a gala.
Challenge
The leadership team of WYWT has realized over the years they are not necessarily getting the right mix of people at these galas to generate the right financial support the organization needs to continue their great work. Additionally, they have employed volunteer scheduling approach of putting their volunteers at the largest stations for 3 shifts a day 5 days a week. The leadership team is starting to believe this type of approach may not be sustainable for their volunteers. WYWT leadership team have a fundamental question, which MTA stations should be targeted by their volunteer staff and what would be the best volunteer schedule?
Methodology
Our team solved this challenge by assimilating data from different freely available sources and performing exploratory data analysis. We will first review the data sources utilized, then discuss the analysis performed on these data sources, next discuss the results from the analysis, and lastly what future work could be done.
Data
We compiled the following data sources,
- MTA Turnstile Data - Historical turnstile data for every turnstile in the MTA network.
- MTA Station Master Data - Location data for every station in the MTA network.
- Grace Hopper - List of major sponsors for the Grace Hopper organization.
The hypothesis is companies who support Grace Hopper should also desire to support WYWT. If we can succesfully identify those stations who are physically close to the list of Grace Hopper companies and analyze the entries by hour for each station, then a volunteer schedule can be generated.
Analysis
We took a two step approach to our analysis.
- Identify all stations which are within walking distance of each of the Grace Hopper locations.
- Once stations are identfied, then the exact time of day can be identified.
Station Identification
The distance was calculated between each MTA Station and 14 of the top donors. Any station not within 0.5 miles of one of the 14 top companies was excluded from the list. The distance threshold of 0.5 miles was chosen as a reasonable amount of walking distance from a MTA station to the person’s origin or final destination.
Here is the analysis visually.

The first map is showing all 14 companies who are significant donors to the Grace Hopper organization, and all of them are located in lower Manhattan. The middle map shows all stations plotted in red within 0.5 miles, and the size of the bubble is the relative size of the station in terms of average daily entries analyzed over May 2018. The last map shows the top 6 stations based on a new score developed for this analysis to take into account average daily entries and their proximity to other companies. The scoring function we used is simple and calcualted as average daily entries times the number of companies within 0.5 miles. The table summarizes the top 6 station-company pairings.
| Station | Avg. Daily Entries | Num of Companies | Score |
|---|---|---|---|
| 34 ST-HERALD SQ | 16,186 | 4 | 64,744 |
| TIMES SQ-42 ST | 14,745 | 4 | 58,982 |
| 42 ST-BRYANT PK | 5,472 | 9 | 49,254 |
| 34 ST-PENN STA | 11,769 | 4 | 47,077 |
| 47-50 STS ROCK | 7,446 | 5 | 37,230 |
| 14 ST-UNION SQ | 15,727 | 2 | 31,455 |
You can see the effect of the scoring by reviewing the Bryant Pk station. The station is on average smaller volume compared to the other stations, but is centrally located to 9 other Grace Hopper companies. Bryant Park makes the list as we conclude the sation is low volumne, but has a higher concentration of people WYWT would desire at their gala.
Station Timing
The list of stations has been narrowed down to top 6, and now the question is when should the volunteers be at each of the 6 stations? This question was answered by first segmenting the MTA turnstile data by day of week and by volunteer shift range. The Morning shift was defined as 7 a.m. - 11 a.m., the afternoon shift as 11 a.m. - 3 p.m., and the evning shift as 3 p.m. - 7 p.m. Segmenting the data in this way allowed us to analyze each potential shift by day of week to identify the top 3 shifts WYWT should target each week for each of the top 6 stations.
For example, let’s look at the Hearld SQ station in the heatmap below.

The darker the color in the heatmap the more people enter the station during that shift and day of week. You can easily see in the heatmap that the top 3 times to be at Herald SQ station is during the evning shift Tuesday - Thursday. This makes a lot of sense as this is the evening commute time and typically a holiday or long weekends will not impact a Tuesday - Thursday type of schedule.
Recommendation
All of this analysis is great, but what exactly can WYWT actually do with this information to change their strategy for their next gala? The key result from this analysis is a schedule. The top 3 shift-day pairings can be determined for each of the top 6 stations and a new volunteer shift scheduled can be generated.
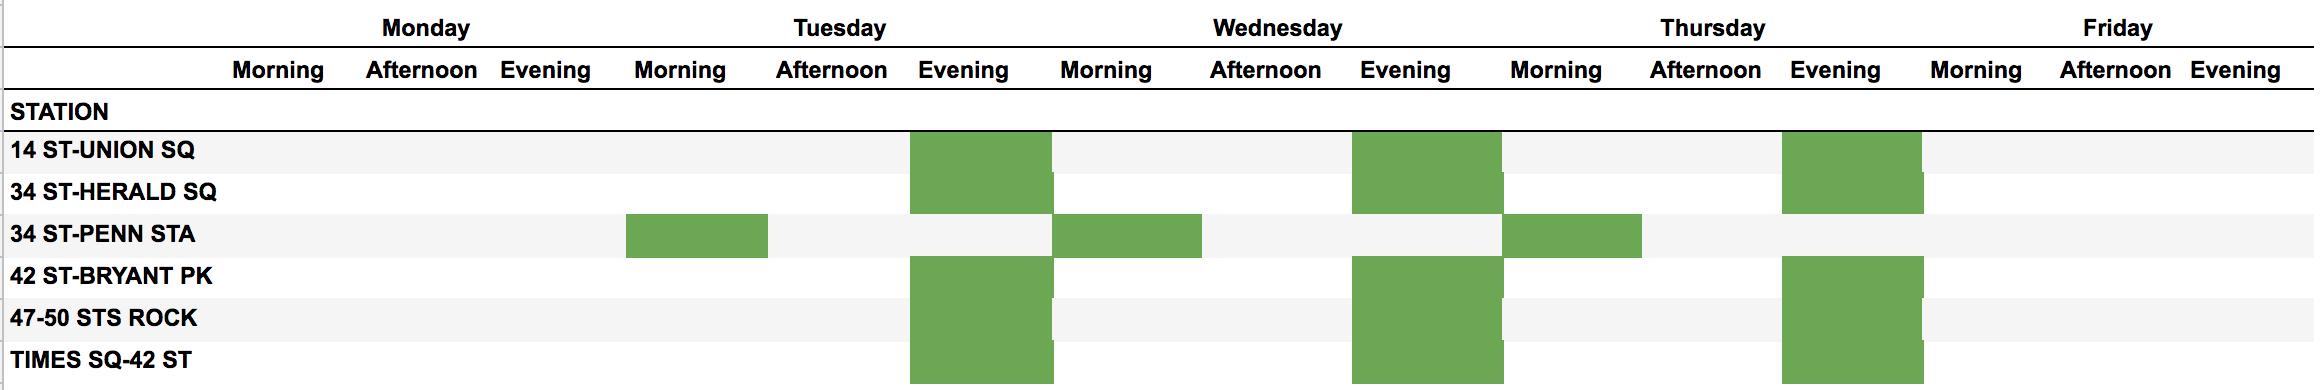
The Gantt chart is showing the 6 stations in the rows and day/shift in the columns. The green cells indicate the suggested shifts. The previous brute force schdeuling methodology would have resulted in 90 shifts for these 6 stations. Our targeted approach resulted in a 18 shift schedule. This is an 80% reduction in volunteer shifts and a better strategy to targeting the right people for the annual WYWT summer gala.
Future Work
The analysis was focused on exploratory data analysis (EDA) which is always a good first step. You would never want to build a complicated machine learning or regression or any other type of model, without first understanding data AND if you are providing the right output for your client / sponsor. Once these activities are completed, then these following areas can be explored further to make a more robust model.
- Incorporating specific demographic data into the station selection algorithm. For example, is WYWT attempting to target a certain household income?
- Consider the size of the company in NYC to influence the station selection algorithm.
- Expand or shorten the company list, in case WYWT has certain compaines they would like to target.
- Incorporating a target number of volunteer shifts and perform sensitivity analysis on adding or subtracting a shift.