E-commerce sites are constantly analyzing and mining web traffic data to gain insight into customer behavior. In particular, e-commerce sites want to know whether or not a visitor is about to make a purchase. If not, then what is holding this visitor back from purchasing? What can be done to encourage the visitor to purchase something in the future?
Each e-commerce site must address these fundamental questions to increase revenue. For my project, I am going to begin to answer these questions by attempting to predict whether each e-commerce visitor will buy or not upon their next visit, based solely on their interaction with the site in their previous session.
Introduction
The data utilized was hosted by Kaggle and provided by RetailRocket. The data were gathered from a real e-commerce website between May 2015 to September 2015. The data set consisted of 3 different types of data,
- events - Transaction log of every event logged by a visitor.
- item properties - Transaction log by week of each item property, i.e. categoryid or item availability.
- category tree - Hierarchal data relating categories to parent categories. This data was not utilized in this analysis.
The data was highly anonymized to protect the identity of the e-commerce web site. The more interesting data, such as price, discount, item category names, etc., were all hidden. However, there was information about the behavior of each visitor. The behavior tracked in the data set were the following 3 events,
- view - A visitor navigated to a page to view an item.
- addtocart - A visitor decided to add the item they were viewing to their virtual cart.
- transaction - A visitor decided to buy the item that was added to their virtual cart.
Given this rich information about each visitor, I wanted to try and predict whether or not a visitor will buy any item, based solely on how the visitor interacted with the site previously. If the e-commerce site could predict who would buy or not, then the site could develop advanced marketing strategies to begin to convert non-buyers into buyers. Implementing an advanced marketing strategy will result in a better allocation of the marketing budget. Targeting the right segement of people with the right promotions, means a reduction in profit erosion. Let’s see how we can apply machine learning to start to build a more advanced marketing strategy for this e-commerce site.
Methodology
Think about how you interact with an e-commerce site, like an Amazon. You as the consumer have some intent when navigating to Amazon. Your intent could be to simply price check something you found on some other site, or see what similar products exist for a high-end product, or you are ready to purchase some item. You do all of this in some amount of time, i.e. 30 minutes, and/or sequence of pages you visit on a site, which is commonly referred to as a session on the site. The machine learning model will attempt to predict the intent, buy or not, in the visitor’s next session.
The event data was in a raw time series form, and no sessions specified for the visitors to the site. First, I needed to define a session and then group the raw event data into session data. A session was defined as anytime there was at least a 30 minute gap between events.
The total number of events in the data set was approximately 2.7 million. These events were then aggregated into 1.7 million sessions. The data was finally filtered down to only those visitors which visited the e-commerce site at least twice between May-September 2015. The final data set used for feature engineering and modeling was 181,000 pairs of sessions. The data from the first session are what will be used to engineer features to predict the buy or not of the second session.
Features
I engineered 6 features to predict whether or not the second session will result in a buy or not.
- view_count - Count of the number of view events in the first session.
- session_length - Length of the first session in minutes.
- item_views - Count of unique items viewed in the first session.
- add_to_cart_count - Count of addtocart events in the first session.
- transaction_count - Count of transaction events in the first session.
- avg_avail - Average availability of the items viewed during the first session. For example, if 3 items were viewed and 1 of them was not available then the average availability for the first session would be 66%.
The item availability data came from the item properties data, and some items in the event data did not appear in the item properties data. Those events with items which did not have item availability were dropped from the analysis data set.
Model Training and Selection
The train/test split was 75/25 and stratified sampling was utilized. I considered 3 different classes of models, Logistic Regrssion, Random Forest, and Gradient Boost (xgboost). The model selection process was decided based on validation AUC of a 3-fold cross validation. There was a signficant class imbalance (1.57%), as most people who visit the site do not buy an item. Ultimatley, applying SMOTE to up-sample the minority class resulted in better model performance. The inital cross-validation results are summarized below.
| Model | Validation AUC |
|---|---|
| Logistic Regression | 0.752 |
| Random Forest | 0.531 |
| Gradient Boost (xgboost) | 0.619 |
The Random Forest model performed the worst, and was not considered further. The Logistic Regression and xgboost models were further hypertuned utilizing BayesSearchCV. BayesSearchCV implements Bayesian optimization to estimate the parameter distribution based on know values of AUC, and guides the optimization algothrim to find the maximum AUC. This results in a more efiicienct search compared to a grid or random search. A great blog post for futher infromation about BayesSearchCV can be found here. The results of the BayesSearchCV are below.
| Model | Validation AUC |
|---|---|
| Logistic Regression | 0.752 |
| Gradient Boost (xgboost) | 0.624 |
The hypertuning did not make a huge impact on the validation AUC. This is usually an indication an additional feature is needed to improve the overall performance of the model. However, the Logistic Regression model performed the best, and will be selected to score on the test data.
Results
Scoring the hypertuned Logistic Regression model against the test data resulted in an AUC of 0.77, and the ROC curve is below.
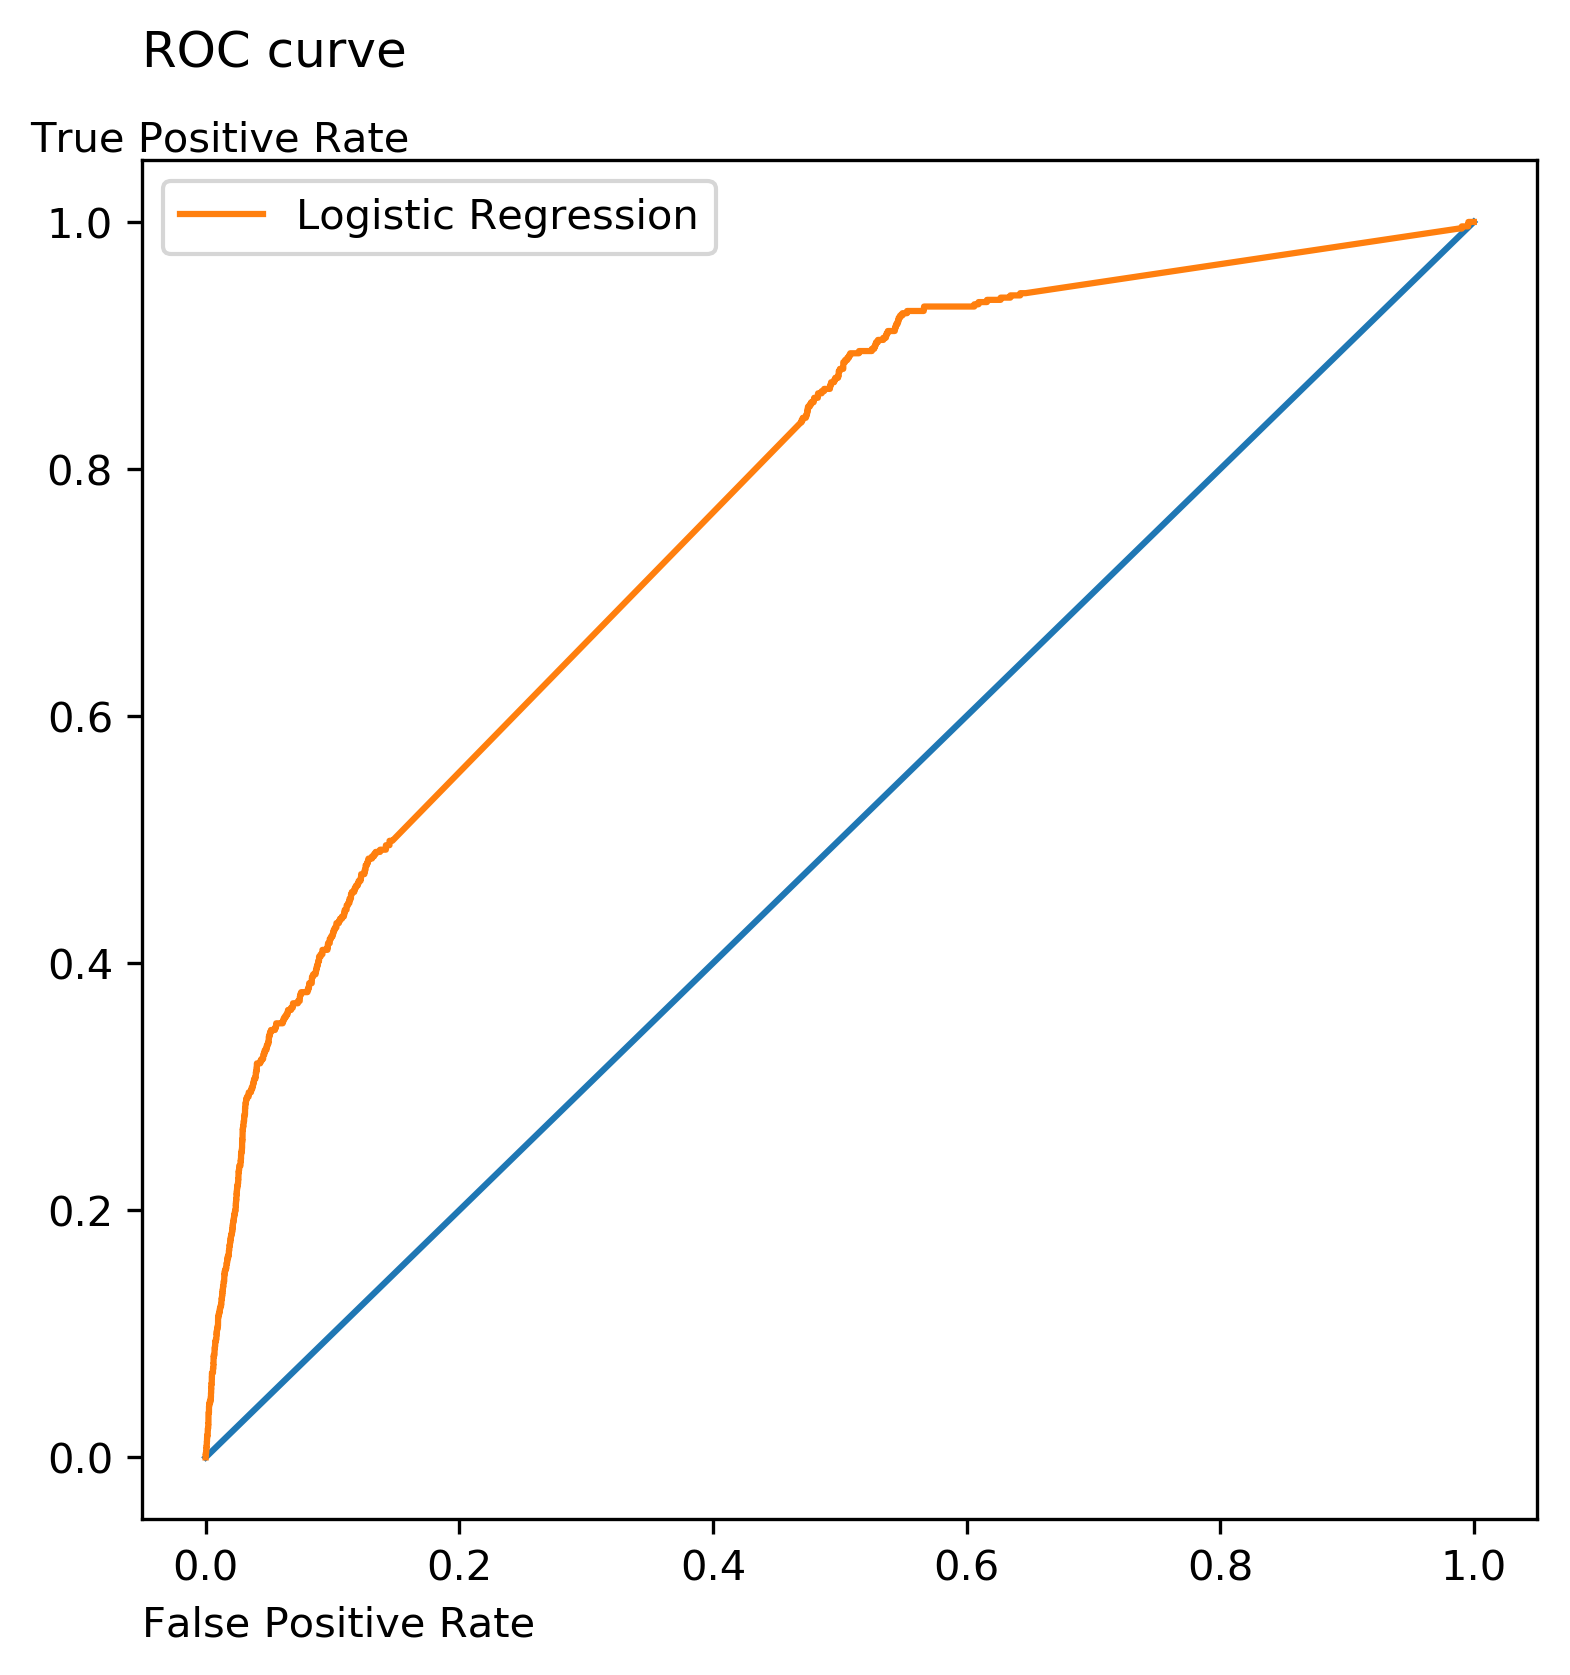 Figure 1: ROC Curve
Let’s now look at the odds ratio for each of the features.
| Feature | Odds Ratio |
|---|---|
| view_count | 1.14 |
| session_length | 1.19 |
| item_views | 0.79 |
| add_to_cart_count | 1.91 |
| transaction_count | 0.97 |
| avg_avail | 2.08 |
The average availability and add to cart count are the two features which have the most postive impact on whether or not the visitor will buy in their next visit. This begins to give us some insight and what areas to focus our attention for improving the site. For example, we can review our inventory policy and determine what can be improved to increase the average item availability. This could be further focused into specific high-margin product categories first and then applied elsewhere based on return on investment.
The other interesting insight is as the numbers of items viewed increase in the first session, then less likely the visitor will buy in the next session. This is also logical in the sense that as user views more items, and can’t find what they want, then frustration builds. This frustration results in a negative experience. The search function of the website can be scrutinized on how to optimize the user experience to enable all users to find the items they want quicker.
Future Work
These inital results highlight value in a visitor’s interactions with the website, but there are probably more features which would improve the overall performance of the model. Here are some ideas for future improvements of the model.
- Additional history - If a visitor frequents the site, then this additional history could give insight into whether or not the visitor will buy next.
- Price / Discount data - Knowledge of the item price and/or discount of the price while the visitor viewed the item could be used as a feature in the model to enhance the predictive power of the model.
- Seasonality - Adding knowledge of known holidays or different buying seasons would also fine tune the model.