Reveiws are ubiquitous these days. I get done with my Uber/Lyft ride, they want a review. I get done riding a Lime bike or scooter, they want a review. I buy something from Amazon, they want a review. The review has almost replaced the reciept; it’s the expected end of every transaction. Are there data or patterns in these reviews that can actually be turned into insights for these respective vendors? This is the broad topic I decided to tackle in my fourth project at Metis.
I narrowed this topic down to analyze whether or not a review can predict if a product will trend. The scope of this project will leverage a data set of Amazon toy reviews, a calculation of whether or not product trends over a 30 day period, and finally an application of the trained model in a Flask app to “improve” a review to encourage a product to trend. Let’s get started!
Methodology
I utilized historical Amazon toy review data provided by Amazon and hosted here. I chose the Amazon data as they popularized the culture of reviewing products, and toys because the toy industry is constantly introducing new products. First, I needed to trim down the data as the Amazon data set ranges from 1995 to 2015. Next, a product trend score needed to be developed to categorize a product as trending or not. Lastly, a machine learning model was developed to transform the review into a feature space and predict whether or not the product will trend or not.
Data scope
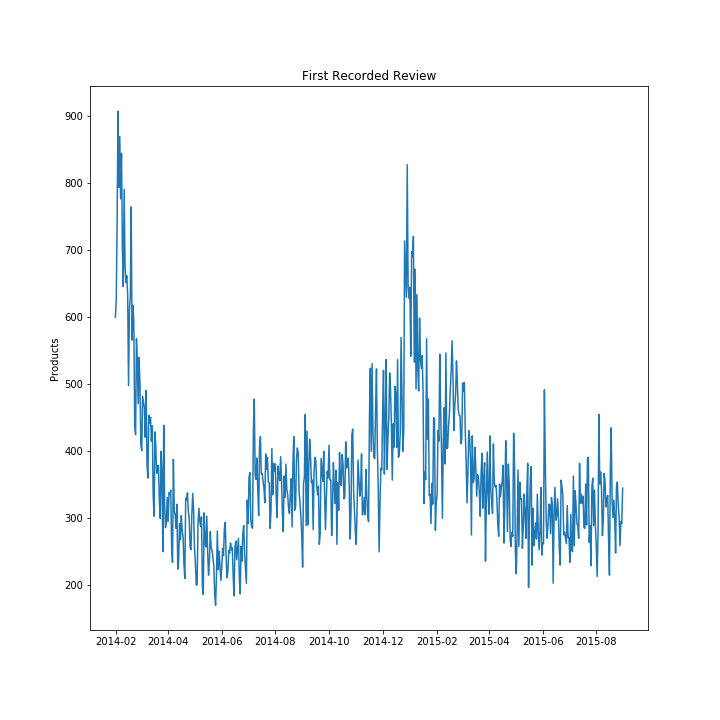
The data was first filtered to consider only 2014 to 2015, which resulted in 211,229 unique products with at least one review. I only considered reviews within a 30-day time window from the first review to calculate the product trend score. The distribution of first reviews can be seen below.
 Figure 1: Time series of when the first review occured for each product.
Product Trend Score
The product trend score needed to be calculated to generate the ground truth for the classification model. The score was calculated based upon the number of reviews, the star rating, and the variability of the star rating. The underlying assumption is customer reviews are correlated to product sales. Ideally, the products would be classified as trending or not by the actual sales data of the respective products, but this was not available, so reviews will be utilized as a proxy.
The trend scores was calculated as,
The Review Success calculation can be interpreted as a product with a lot of reviews, high star rating, and consistently rated will result in a high Review Success. The Trend Score is simply a normalization of the Review Success metric onto the tanh space. This results in Trend Scores ranging from 0 to 1.
Finally, a product was classified as trending or not if the product had a trend score in the top 1% of the population. Essentially, only 1% of the toys are assumed to have actually trended.
Topic modeling
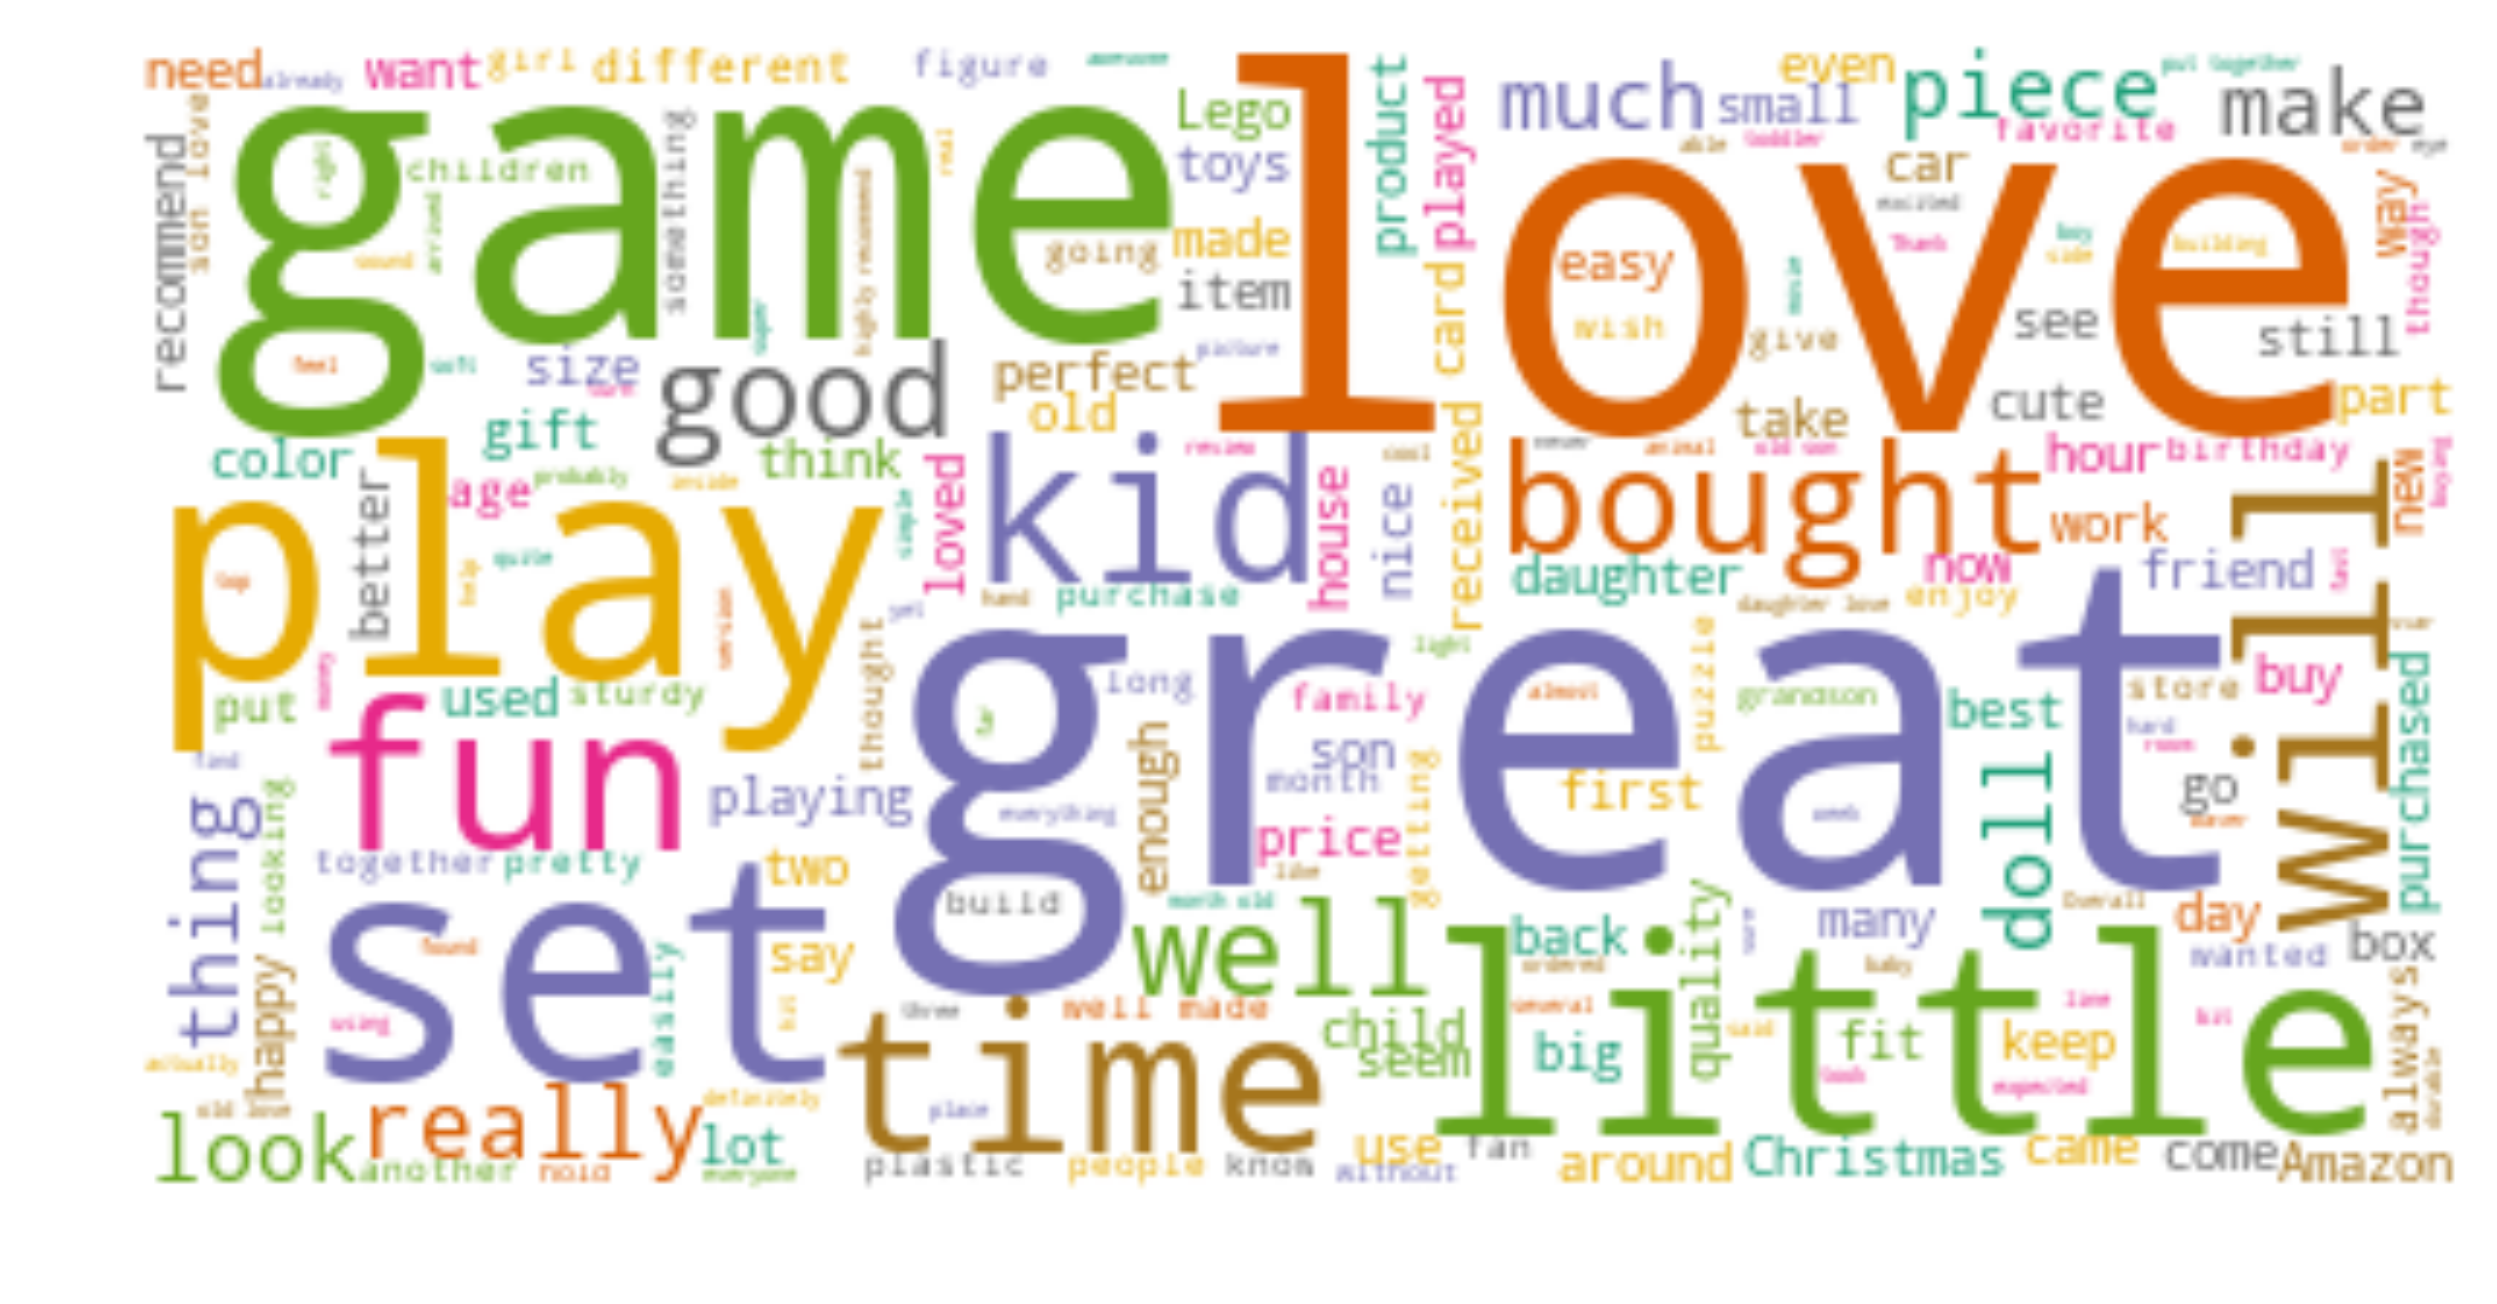
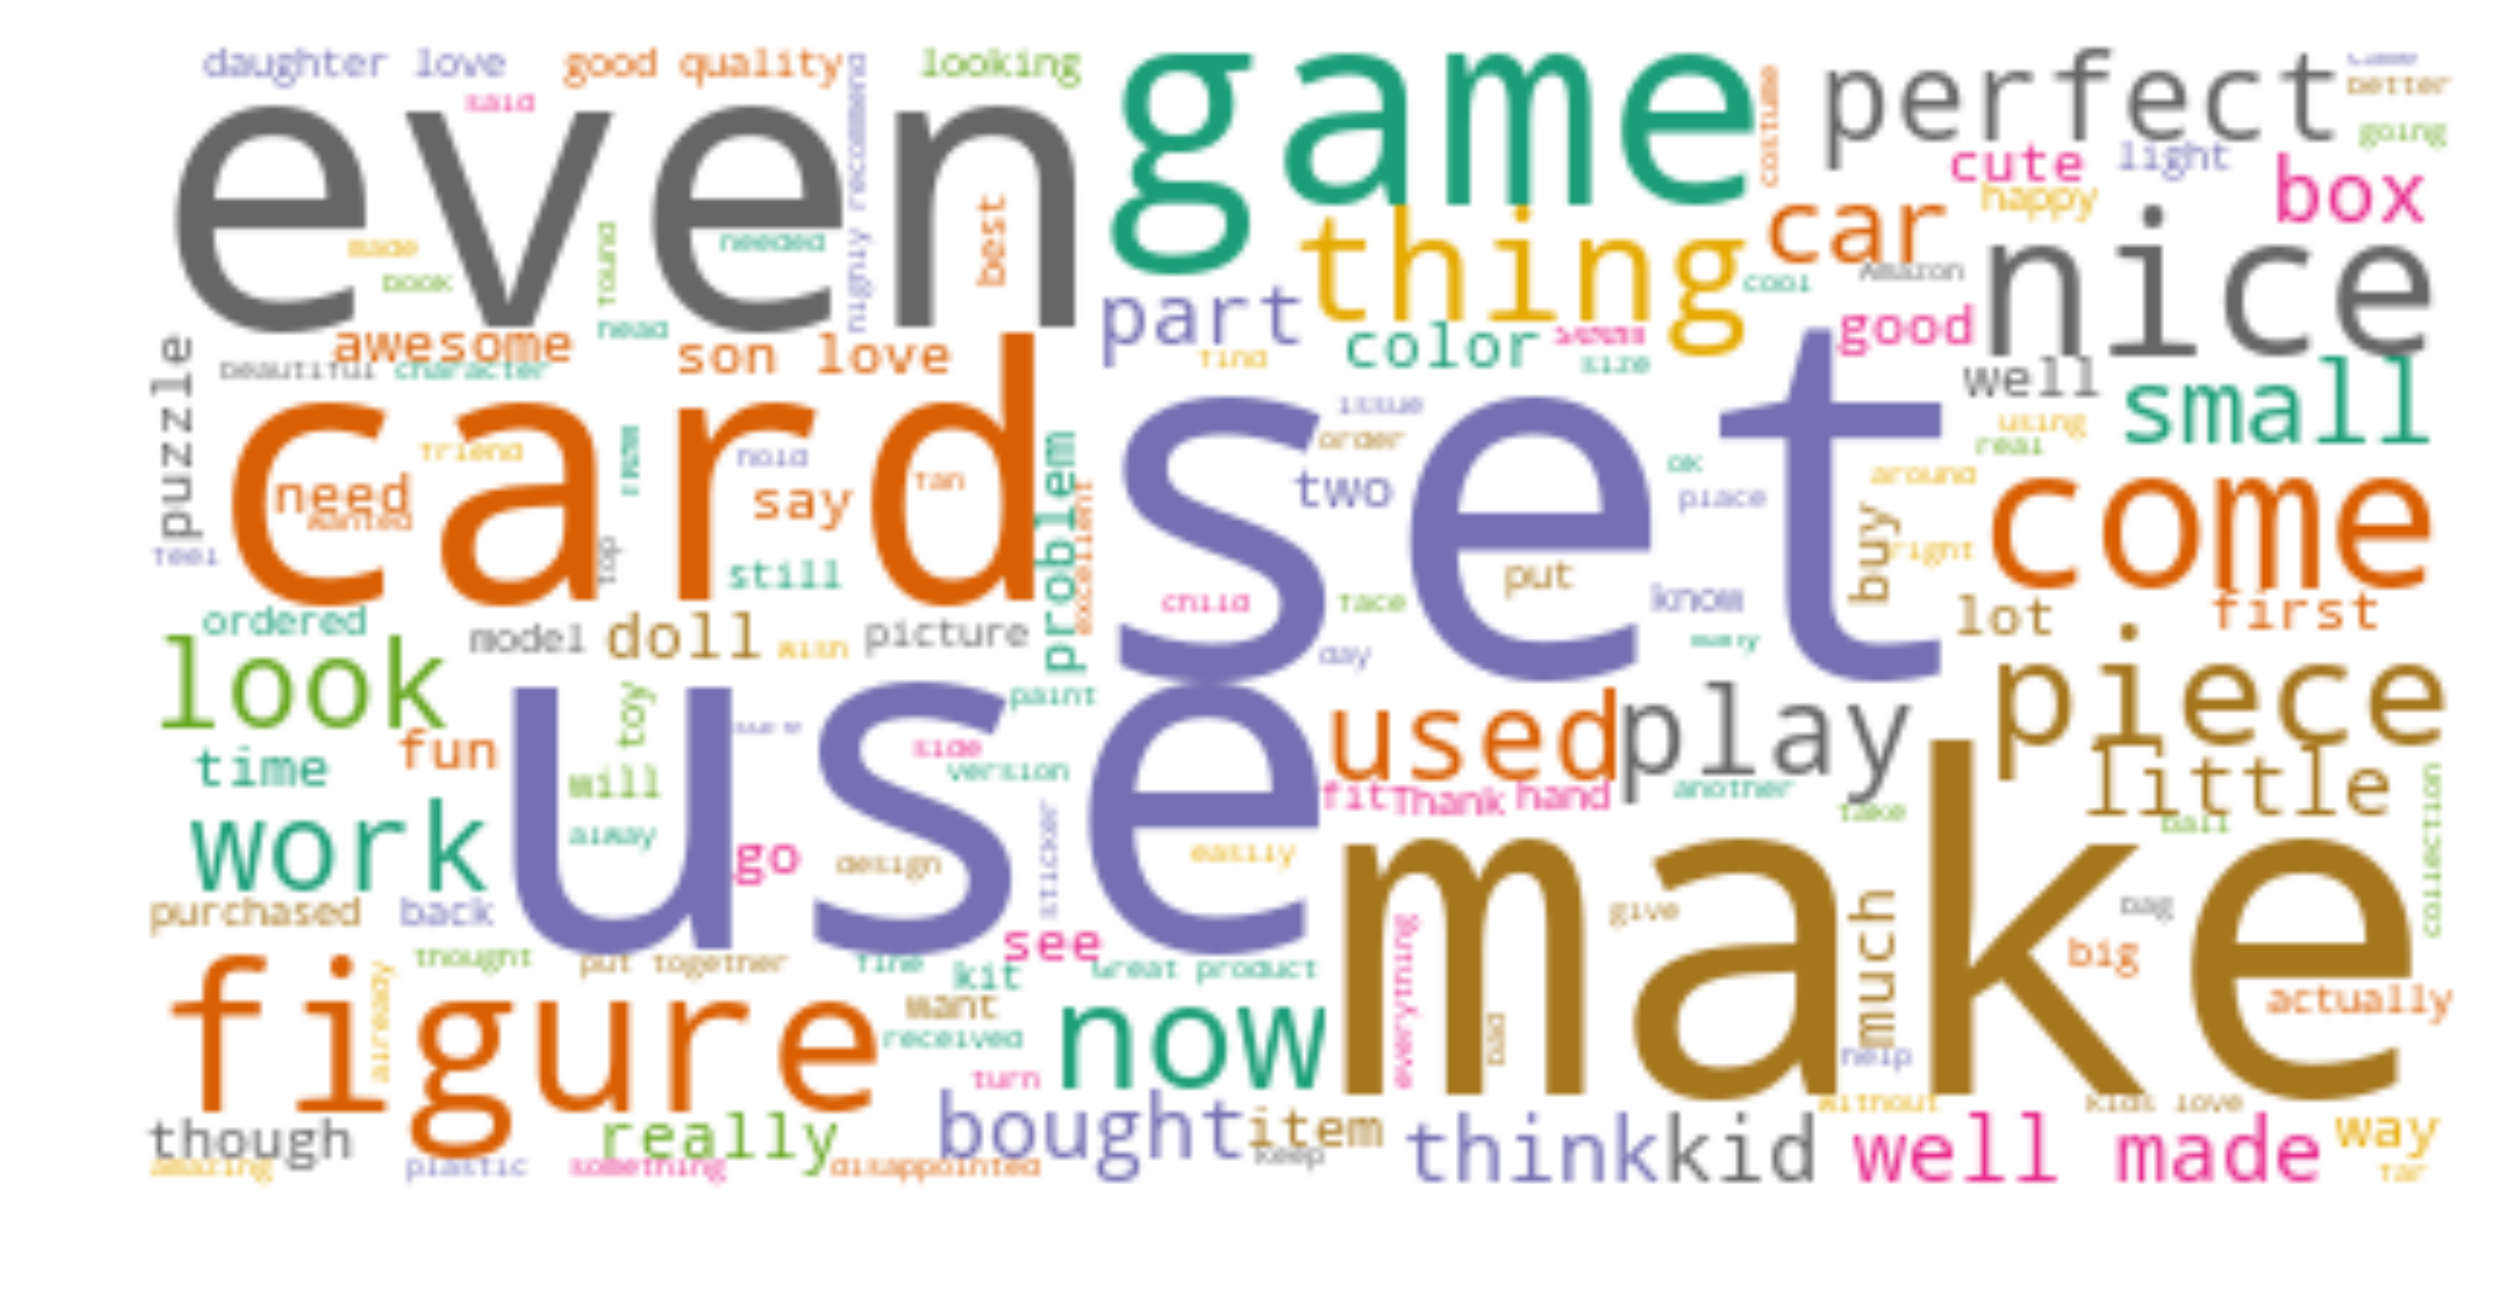
The goal of this model was to determine if the first review for each product could signal whether or not the product will trend over the first 30 days. I generated word clouds for the trending and not trending products to see if there could be any high level differences between the two groups.
 Figure 2: Common words in product reviews which trended
 Figure 3: Common words in product review which did not trend
You can see there are some high-level differences between the trending and not trending products. I preformed a train/test split of 75/25, and then extracted these differences by utilizing a LDA model on the count vectorization which included single and bi-grams of the first review. I found 5 topics to make the most sense in terms of accuracy for my classification model. A sampling of the most common word in each topic are given in the table below.
| TOPIC 0 | TOPIC 1 | TOPIC 2 | TOPIC 3 | TOPIC 4 |
|---|---|---|---|---|
| br | one | great | old | good |
| br br | use | veri | year | veri |
| play | get | doll | cute | look |
| game | work | perfect | year old | like |
| fun | onli | product | daughter | nice |
| kid | would | well | littl | figur |
| set | time | thank | toy | qualiti |
| great | becaus | gift | bought | pictur |
| grandson | like | arriv | birthday | price |
| togeth | back | item | size | color |
Classification model selection
I chose to use XGBoost gradient boosting classifier algorithm to train my model. I considered a 5 and 10 topic model generated from my LDA model in the previous step. I also considered upsampling the 5 topic model with a SMOTE strategy and also a SMOTE + Tomek link elimination, since the problem is imbalanced. I trained the model by performing a 5 fold cross-validation utilizing a Bayesian Search to select my parameters for the XGBoost model. All four models had very similar validation AUC scores. I decided to keep it simple and utilize the 5 topic model with SMOTE upsampling. The summary of scores are listed below.
| Model | Validation AUC |
|---|---|
| 5 topic | 0.711 |
| 5 topic SMOTE | 0.712 |
| 10 topic | 0.711 |
| 10 topic SOMTE + Tomek | 0.716 |
The XGBoost parameters selected were.
| Param | Value |
|---|---|
| gamma | 0.222 |
| learning_rate | 0.459 |
| max_depth | 2 |
| n_estimators | 490 |
I then needed to decide the probability cut-off to classify a product as trending or not. The error tradeoff is the following scenario,
- If my model predicted a product will trend, but in fact does not trend then this will result in excess inventory. This is the false-positive cost and is equivalent to the inventory holding cost.
- If my model predicted a product will not trend, but in fact does trend then this will result in lost sales (due to not having enough inventory). This is the false-negative cost and is equivalent to the cost of a lost sales.
I chose my cost using an example product with $10 cost of goods sold (COGS), a 20% annual inventory holding cost, and a 50% markup. The equivalent false-positive cost for holding 1 month of inventory would be,
- false positive cost = COGS * (.0167) = 0.167
Likewise, the false-negative cost would be,
- false negative cost = COGS * (1+0.5) = 15
This analysis resulted in a probability cut-off of 0.482.
Results
In general, we are more concerned with recall as being able to correctly identify the trending products is crucial for being able to capitalizing on the market trends and ultimately creating an established product. My model was able to identify 390/558 products which previously trended as trending, or 70%.
In conclusion, the first review did provide some initial insight into whether or not a product will trend or not. I would love to enhance the model in the following ways,
- Obtain actual product trend information to determine how accurate my proxy trend score is to a trend metric derived from historic sales.
- Determine if adding more reviews, e.g. the first n days the product is on the market, to see if this improves the overall recall of my model.
- Would also like to explore a model with word embeddings to determine if this would improve model recall by relating similar documents in a word embedding space, instead of an LDA topic model.
Review generator app
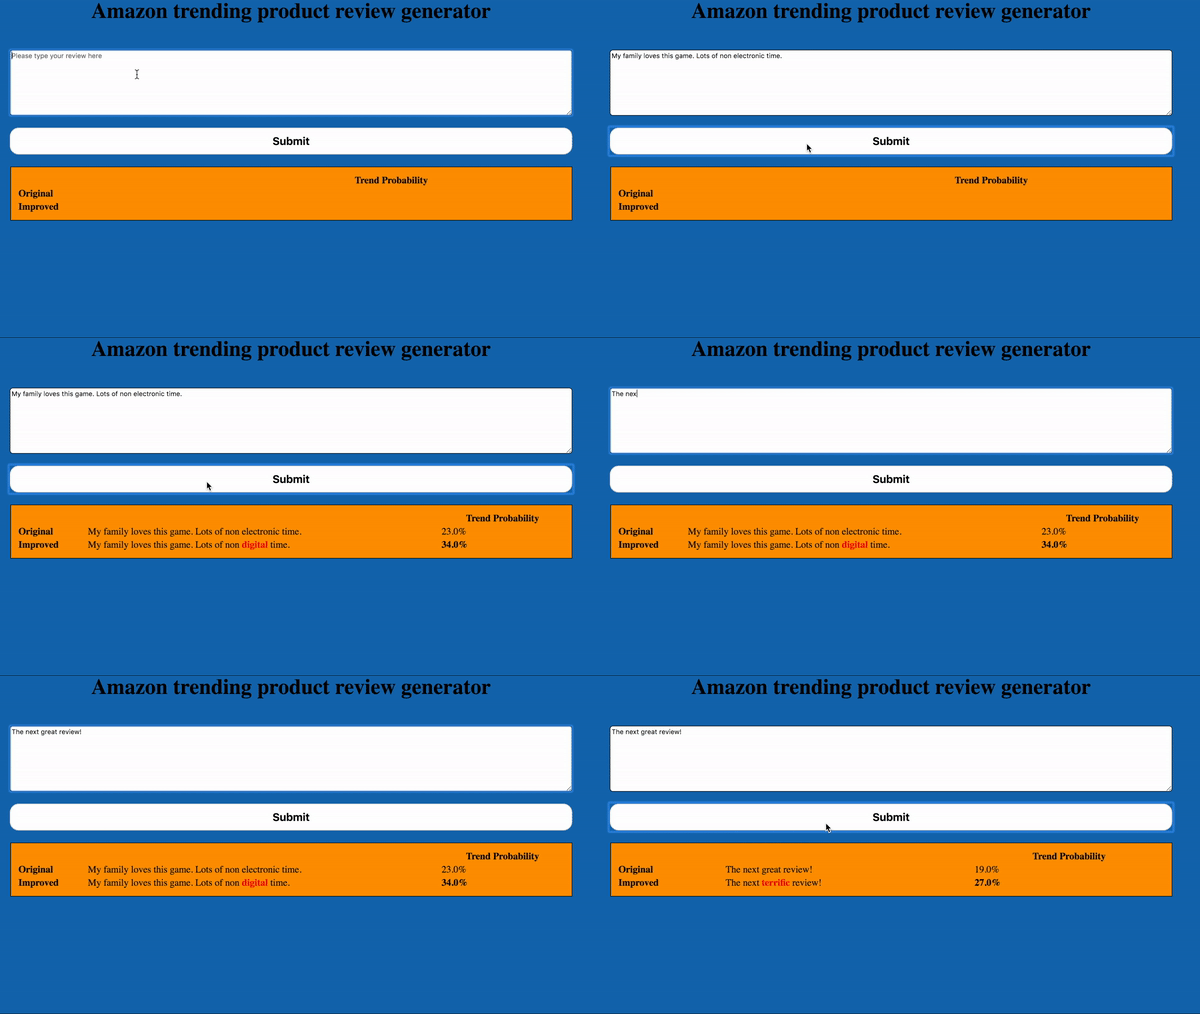
I decided to productize my model by creating a Flask app which takes a review, determines the review trending probability, and analyzes the submitted review to see if a single word could be swapped out to improve the trend probability. A screen shot of the app is below.
 Figure 4: Demo of the review app
I would love to enhance the app further by attempting to replace phrases instead of single words. Could it be possible to provide a product description, and then generate a review which would encourage the product to trend the most?